Looking Into Why Ian Desmond Has Been A Massive Disappointment This Season


In the Nationals’ 7-2 victory over the 2nd place Mets, Ian Desmond hit a long opposite field two-run homer off of reliever Alex Torres. The homer was his first of July and just his 8th of the year for the shortstop who had hit at least 20 in the past 3 seasons. Desmond has been universally hated this season for his atrocious defensive play (his 21 errors are the 2nd most in baseball), his average is just above the Mendoza line, and his overall inability to function as a major league baseball player. I graded Desmond’s first half as an F- and #TreaTime just can’t come sooner enough for many Nats fans. Turner, a top SS prospect currently playing in AAA was written about in depth here.
WARNING: the statistics to follow may make you hate Ian Desmond even more. Proceed with caution.
From May 30th until before yesterday, Ian Desmond has hit a whopping .128, has gotten on base 16.7% of the time, and has slugged just .210. This is a Major League Baseball player and those stats look like they belong on a breathalyzer. Not good. Not even bad. Virtually impossible. In 151 plate appearances, Desmond reached base just 24 times.
Desmond has had a very low batting average on balls in play during that time and, while his batting average on balls in play (or BABIP) should rise if he continues to get playing time, he’s been a lot more than unlucky. In Desmond’s MLB career, he has struck out 23% of the time but this season its jumped to a much higher 28.8%. His K rate last season was also slightly above 28% but the glaring difference is that last season he walked. He walked in 7.1% of his plate appearances in 2014; in 2015? just 4.7%. Desmond has also stopped running (just 5 steals this season after having 91 in the past 4 seasons) but he has so many problems that, in the interest of time, we’ll just skip over that.
What’s left to bash Desmond on? Oh, that’s right, power. Desmond has just 8 bombs all season after perennially hitting 20. A simple look at his statistics would show that his Homerun/Flyball (HR/FB) rate (a statistic that indicates the percentage of flyers that leave the park) is 9.2% this season – much lower than his career average and nearly half as much as the 18.2% he put up last year. Now, HR/FB rates tend to stabilize so this could be promising! Maybe, at the very least, Desmond’s power will return! Nope. Last season, the distance of his fly balls was 297 feet (good for 24st best in baseball), this season his fly ball distance has plummeted to 280 feet (122nd in baseball). While HR/FB distances tend to stabilize, this assumes that there hasn’t been a big change in overall flyball distance and, unfortunately there has.
So: thus far, we have deduced that Desmond is striking out more, not hitting balls as far, walking less, running less, and playing poor defense. Why is he so bad? As Owen Watson of fangraphs.com found, the biggest culprit for Desmond’s struggles have been his ineptness hitting balls up and in in 2015.
Desmond’s isolated power (basically raw power) on balls up and in looked like this in 2014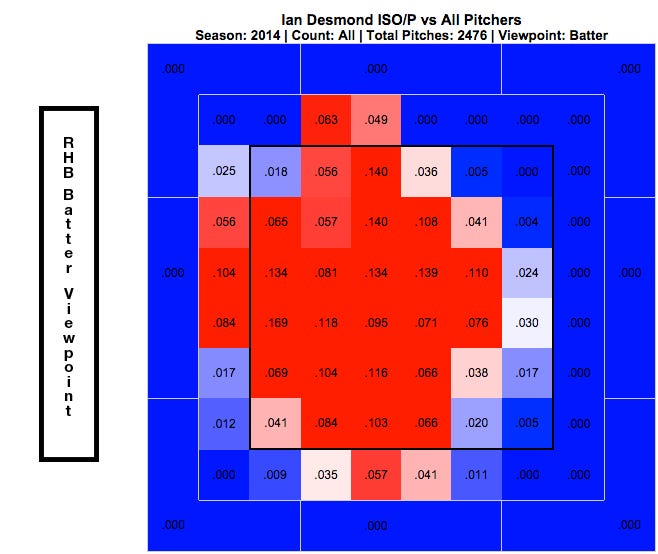
It looks a lot bluer here in 2015 and you and I have done literally the same amount of damage (maybe even less because we haven’t gotten out yet) as Ian Desmond on Major League pitching up and inside. 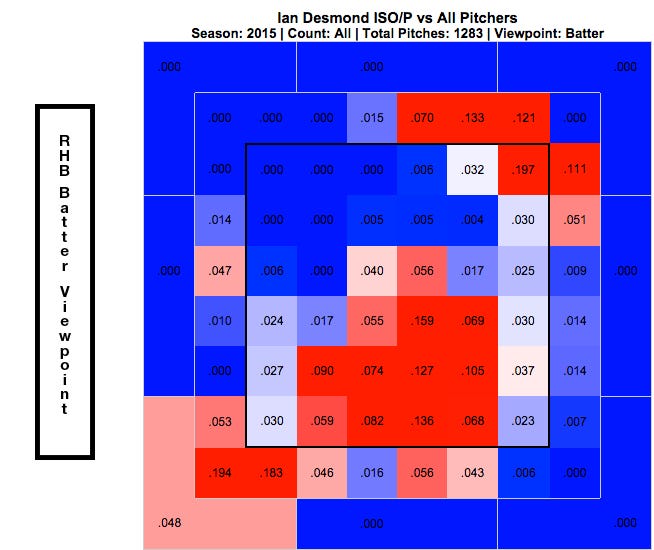

The Verdict: Yup, Desmond sucks and, unless he can somehow regain the bat speed that he had in previous years, he should continue to struggle and pitchers will continue to exploit this fatal weakness. So we have known that Desmond has sucked for a while but now we know why he’s been so bad. On a Nats team that has been decimated by injuries since opening day, one can only hope and pray that Desmond’s HR last night will get him going on the right track. If anything, his second half can’t possibly be worse than his first, so he has nothing but room for improvement.
I’m the new Nats writer on this site. Please follow and contact me on twitter at @NatsBarstool